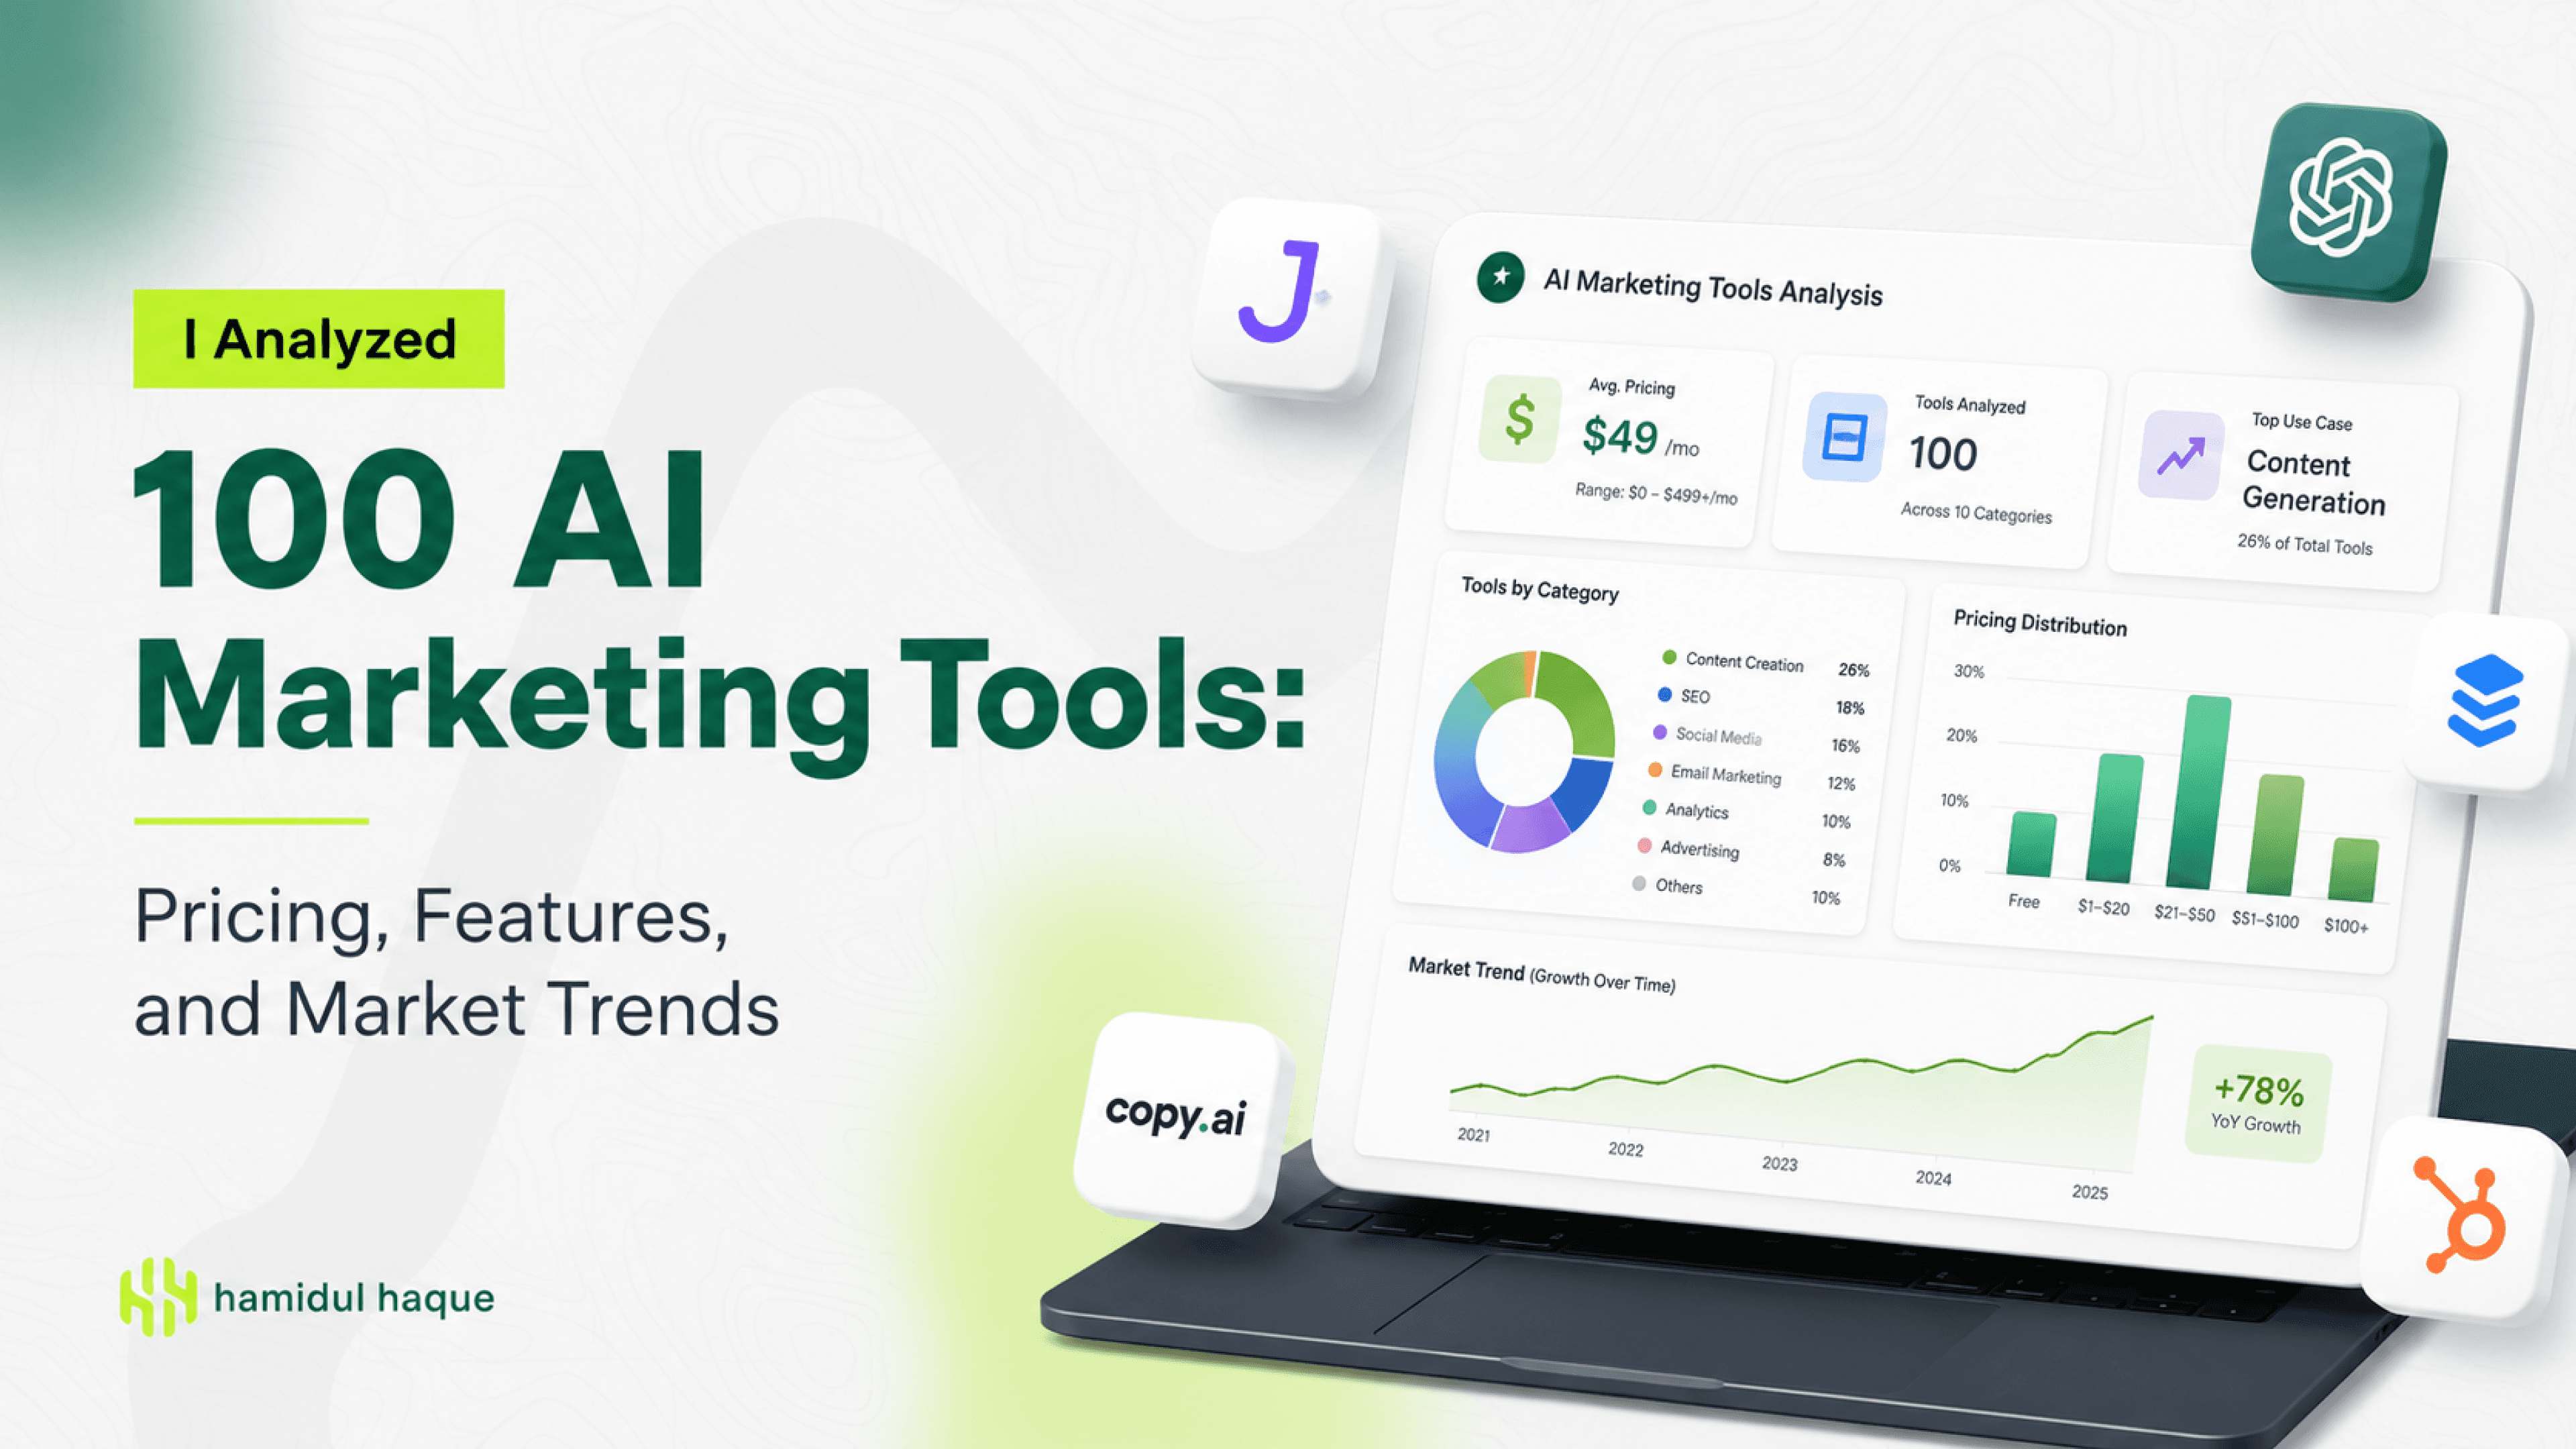
I Analyzed 100 AI Marketing Tools: Here’s What the Data Shows
When I searched for AI marketing tools, I found hundreds of product lists. Most of them explained what each tool claimed to do, but very few showed how the market was actually structured.
I wanted clearer answers.
How much do AI marketing tools cost? Which categories offer the most free plans? What features appear across the largest number of platforms? Who are these tools built for? And do expensive products actually provide more capabilities?
So I created my own dataset.
Get the Data Behind This Analysis
Explore the complete dataset of 100 AI marketing tools, including pricing, features, access options, target audiences, and API availability.
Download Full Dataset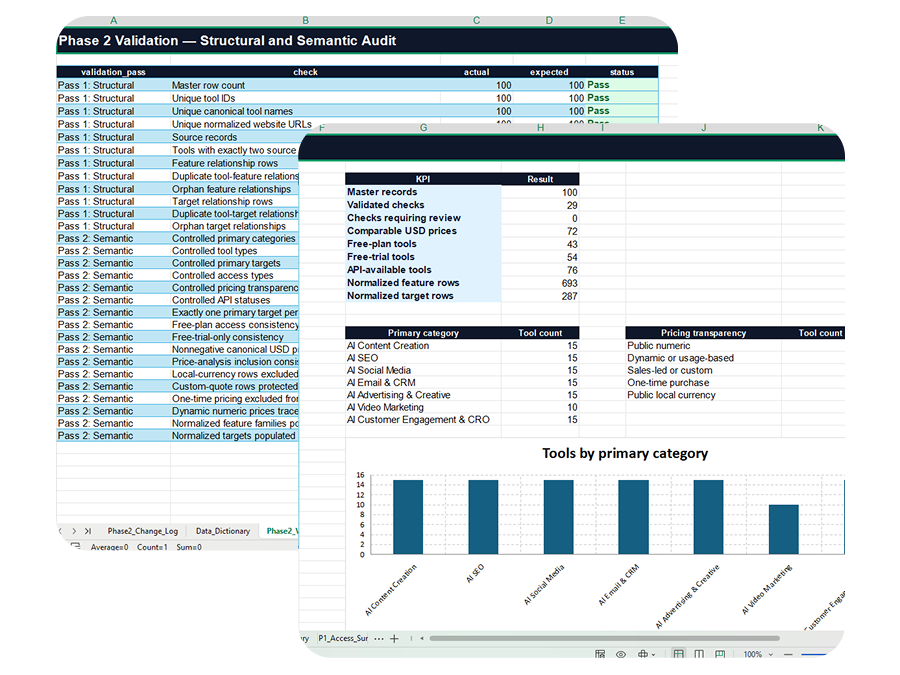
I collected and analyzed 100 active AI marketing tools across seven categories:
- AI content creation
- AI SEO
- AI social media
- AI email and CRM
- AI advertising and creative
- AI video marketing
- AI customer engagement and conversion optimization
For each tool, I reviewed its official website, pricing information, access options, product features, target customers, pricing model, and API availability. I verified every entry twice before cleaning and standardizing the data for analysis.
This process mattered because AI marketing companies do not present their information in the same way. Some publish a clear monthly price. Others show only annual billing, calculate prices based on usage, or ask potential customers to contact sales. A free plan is also different from a limited free trial, even though many tool comparisons treat them as the same thing.
I separated these details instead of forcing every product into one simple comparison.
Out of the 100 tools I analyzed, 72 had comparable public pricing in US dollars. I used those 72 tools to calculate average and median starting prices. Custom quotes, dynamic pricing, one-time payments, and unconverted local-currency prices were excluded from numerical averages.
I also standardized similar feature names. For example, labels such as “AI writing,” “text generation,” and “AI content generation” were grouped under a consistent feature category where appropriate. This allowed me to compare tools without counting slightly different wording as separate capabilities.
The final dataset helped me examine:
- Pricing and price transparency
- Free plans and free trials
- All-in-one versus specialized tools
- Common AI marketing features
- Primary and secondary target customers
- Pricing models
- API access
- The relationship between price and feature count
This is not an exhaustive census of every AI marketing tool available. I selected 100 active products and structured the dataset across seven categories so I could compare them consistently. The category totals therefore represent the composition of my sample, not the total market share of each category.
This is also not a ranking based on affiliate commissions or promotional claims. I am using the data I collected to show what the current AI marketing tools market looks like, where the major differences appear, and what buyers should check before choosing a platform.
Here is what I found.
How I Collected and Analyzed the Data
I did not want this study to become another list built from product descriptions and affiliate pages. I wanted a dataset that I could check, clean, and compare consistently.
I started by selecting 100 active AI marketing tools across seven primary categories. I used the tool’s main marketing use case to assign its primary category, even when the platform could fit into several categories.
The seven categories were:
- AI content creation
- AI SEO
- AI social media
- AI email and CRM
- AI advertising and creative
- AI video marketing
- AI customer engagement and conversion optimization
For each tool, I reviewed the official website, pricing page, product pages, documentation, and integration information where available.
I collected data on:
- Starting price
- Free-plan availability
- Free-trial availability
- Trial length
- Pricing model
- Primary target customer
- Tool type
- Main features
- API availability
- Public integrations
- Pricing transparency
I verified every tool twice before including it in the final dataset. The first check confirmed that the product was active and that I was using its current official website. The second check focused on pricing, access options, and other product details.
This additional verification helped me catch rebrands, redirects, outdated product names, and pricing pages that had changed.
How I standardized the pricing data
Pricing was one of the most difficult parts of the analysis because companies present their plans in different ways.
Some tools show a straightforward monthly price. Others promote an annual plan by displaying its monthly equivalent. Some calculate the price based on contacts, credits, users, advertising spend, or usage. Enterprise tools often do not publish a price at all.
I kept these pricing types separate instead of treating them as equal.
When a tool published both monthly and annual billing, I recorded the standard monthly price and stored the annual monthly equivalent separately. I did not use temporary promotions or discounted introductory offers as the main starting price.
Out of the 100 tools I analyzed, 72 had comparable public pricing in US dollars. All numerical pricing averages and medians in this study are based on those 72 tools.
I excluded the following from numerical averages:
- Custom quotes
- Dynamic or usage-based prices without a fixed entry point
- One-time payments
- Unconverted local-currency prices
- Unavailable pricing
This means a blank price does not represent a free product or a zero-dollar plan. It means the tool did not have a directly comparable public USD price.
How I cleaned the features and customer segments
Companies often use different wording for similar capabilities. One platform may describe a feature as “AI writing,” while another calls it “text generation” or “AI content creation.”
I standardized similar terms before counting them.
For example, I grouped closely related labels under consistent feature names such as:
- AI text generation
- AI image generation
- Analytics and reporting
- Marketing automation
- Team collaboration
- API access
I also separated multi-value fields into individual records. If a tool targeted marketing teams, agencies, and small businesses, I counted each audience relationship separately while keeping one primary target customer for the main comparison.
This allowed me to analyze both:
- The primary audience each tool focuses on
- The broader customer groups mentioned in its positioning
What this dataset represents
This study is based on a selected sample of 100 active tools. It is not an exhaustive count of every AI marketing platform available.
I structured the sample across seven categories so I could compare pricing, features, and access models consistently. Because of that, the number of tools in each category reflects my dataset design, not the total size or market share of that category.
The data was verified on August 5, 2026. Pricing and product features can change, so the findings represent the market at the time of collection.
AI Marketing Tools Market Overview
Before comparing individual categories, I first looked at the overall structure of the dataset. This gave me a clear picture of how these 100 tools are positioned, how accessible they are, and how much buyers can expect to pay.
Key Findings From the 100 AI Marketing Tools I Analyzed
The overview immediately showed that the market is dominated by broad platforms rather than narrowly focused products.
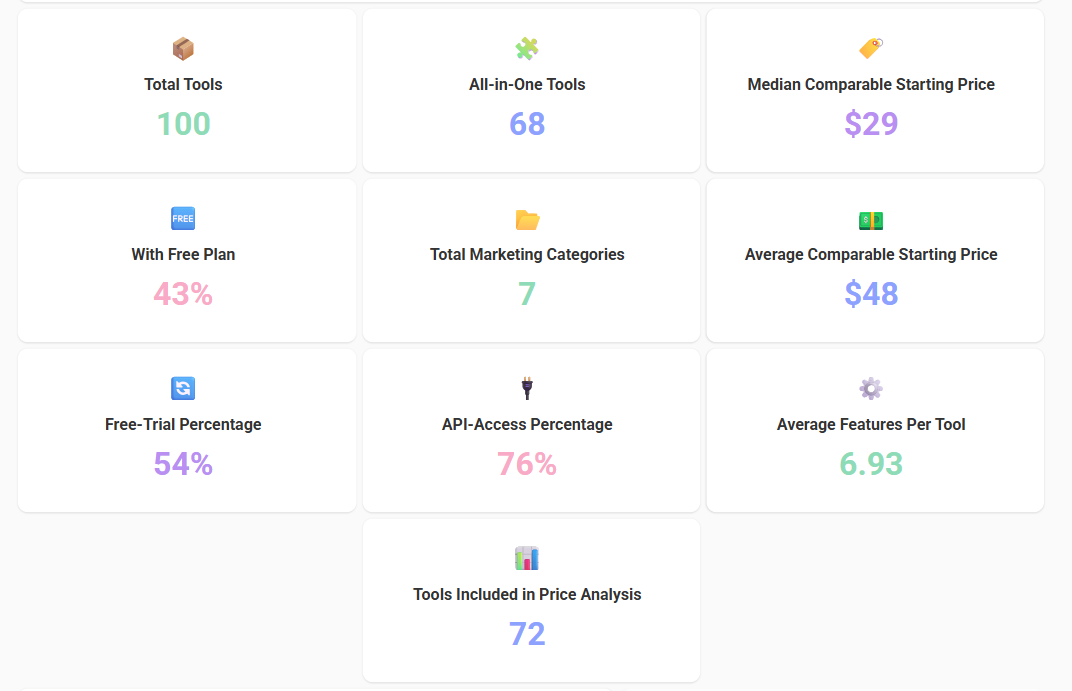
Out of the 100 tools I analyzed, 68 were all-in-one platforms and 32 were specialized tools. I classified a product as all-in-one when it supported several marketing workflows, such as content creation, analytics, automation, campaign management, or customer engagement. Specialized tools focused more heavily on one specific function.
Access was also relatively common, although permanent free access was less available than temporary testing.
I found that:
- 43% of tools offered a permanent free plan
- 54% offered a free trial
- 76% provided public, limited, or documented API access
- The average tool included 6.93 tracked features
The difference between free plans and free trials matters. A free trial allows users to test a paid product for a limited period, while a permanent free plan can support ongoing use without an immediate subscription.
Pricing was less straightforward.
Only 72 of the 100 tools had public prices that I could compare directly in US dollars. Across those tools, the average comparable starting price was approximately $48 per month, while the median was $29.
The median gives a more realistic picture of what a typical buyer may encounter. A small number of expensive SEO, advertising, and optimization platforms increased the overall average, while most tools were priced closer to the $29 midpoint.
My main takeaway from the overview is that buyers have plenty of options, but direct comparisons are not always easy. Many tools offer free access or trials, while almost one-third of the products I reviewed did not publish a straightforward price that could be included in the numerical analysis.
Most AI Marketing Tools Position Themselves as All-in-One Platforms
After reviewing the overall market numbers, I wanted to see whether most products focused on one specific task or tried to cover several parts of the marketing workflow.
I classified 68 of the 100 tools as all-in-one platforms. The remaining 32 were specialized tools.
An all-in-one tool typically combines several capabilities inside one platform. Depending on the product, this may include content creation, campaign management, analytics, automation, customer engagement, or team collaboration.
Specialized tools take a narrower approach. They usually concentrate on one main function, such as SEO optimization, video creation, ad management, email personalization, or conversion analysis.
The 68% share does not mean every all-in-one platform provides the same level of depth. Some include a broad range of advanced features, while others combine several basic tools under one subscription.
The same applies to specialized products. A smaller feature list does not automatically make a tool less useful. In many cases, a specialized platform may provide more control, accuracy, or workflow depth for one particular job.
From a buyer’s perspective, the choice depends on how the tool will fit into an existing marketing process.
An all-in-one platform may be more practical for a small team that wants to reduce the number of subscriptions and manage several tasks in one place. A specialized tool may be a better choice for a team that already has an established software stack and needs to solve one specific problem.
What stood out to me is that most AI marketing companies are no longer positioning themselves around a single AI feature. They are increasingly packaging AI inside broader marketing platforms that aim to support multiple workflows.
How I Distributed the 100 Tools Across Seven Categories
To make the comparisons useful, I divided the dataset into seven primary categories based on each tool’s main marketing use case.
I included 15 tools in six categories and 10 tools in AI Video Marketing.
The category breakdown was:
- AI Content Creation: 15 tools
- AI SEO: 15 tools
- AI Social Media: 15 tools
- AI Email and CRM: 15 tools
- AI Advertising and Creative: 15 tools
- AI Customer Engagement and CRO: 15 tools
- AI Video Marketing: 10 tools
I used a structured sample because I wanted enough tools in each category to compare pricing, access models, features, and target customers without allowing one large category to dominate the analysis.
This chart should not be interpreted as market share.
For example, the fact that AI SEO and AI Content Creation both contain 15 tools does not mean the two categories are equal in total market size. It only means I selected the same number of products from each category for this study.
The same applies to AI Video Marketing. It appears smaller in the chart because I included 10 tools, not because the category necessarily represents a smaller share of the overall AI software market.
I assigned one primary category to every product, even when a tool could fit into several groups. This prevented the same tool from being counted multiple times in the category-level analysis.
For instance, an AI content platform may also provide SEO recommendations, social media captions, and image generation. I still placed it in the category that best represented its main product positioning and core workflow.
This structured approach made the category comparisons more consistent, but it also means the findings should be read as comparisons within my selected sample rather than a complete census of the market.
How Accessible Are AI Marketing Tools?
Price is only one part of choosing a marketing platform. Before paying for a tool, most users want a way to test it, understand the workflow, and confirm that it solves the problem they have.
That is why I separated permanent free plans from time-limited free trials.
A free plan allows someone to continue using a restricted version of the product without paying. A free trial provides temporary access and usually requires the user to upgrade once the trial ends.
Across the complete dataset, I found that 43% of tools offered a free plan, while 54% offered a free trial. But those overall percentages hide major differences between categories.
Free Trials Are More Common Than Free Plans in Most Categories
I compared free-plan and free-trial availability across all seven categories to see where users had the easiest opportunity to test a tool before subscribing.
AI Video Marketing stood out immediately. Nine of the 10 video tools in the sample offered a free plan, giving the category a 90% free-plan rate. However, only 20% offered a separate free trial.
This makes sense from a product perspective. Many AI video platforms use a freemium model where users can create a limited number of videos, exports, or credits each month. Instead of providing unrestricted access for a few days, they let users test the core workflow through permanent usage limits.
AI Social Media followed a different pattern. Only 40% of the tools offered a permanent free plan, but 80% provided a free trial. This suggests that social media platforms are more likely to give users temporary access to their paid features before requiring a subscription.
AI SEO also relied heavily on trials. I found that 66.67% of the SEO tools offered a free trial, compared with 33.33% offering a permanent free plan.
The same trial-first pattern appeared in AI Email and CRM. In this category, 66.67% offered a free trial, while 46.67% provided a free plan.
AI Customer Engagement and CRO was one of the few categories where permanent free access was more common than a temporary trial. Half of the tools offered a free plan, while 40% offered a free trial.
The main lesson is that “free access” does not mean the same thing across every category.
Someone looking for an AI video tool has a strong chance of finding a permanent free tier, although usage may be restricted by credits, watermarks, export limits, or video length. Someone comparing social media, SEO, or email tools is more likely to receive temporary access to a paid plan instead.
For buyers, this distinction matters. A free trial is useful for testing advanced features quickly, but a free plan is generally better for ongoing light use, learning the platform, or operating with a limited budget.
Access Models Differ Significantly Across AI Marketing Categories
The previous comparison showed how often tools offered free plans or trials. I then grouped every product into one primary access type to see how users are most likely to enter each category.
The four access types were permanent free plan, free trial only, demo only, and paid only. Because each tool appears in one group, the percentages within every category add up to 100%.
AI Video Marketing had the most accessible entry model in the dataset. Nine out of the 10 tools offered a permanent free plan, while the remaining tool provided a trial. None of the video platforms in my sample were classified as demo-only or paid-only.
AI Social Media also gave users plenty of opportunities to test products before paying. Around 66.67% of the tools were available through a free trial only, while 26.67% offered a permanent free plan. The remaining 6.67% required a demo.
AI SEO followed a similar trial-led model. More than half of the tools, 53.33%, offered a free trial without a permanent free tier. Another 40% provided a free plan, leaving only a small paid-only share.
The access mix was more restrictive in AI Content Creation. I found that 46.67% of the tools were paid-only, while 33.33% provided a free trial. The remaining products were divided between free-plan and demo-led access.
AI Advertising and Creative had the most varied distribution. In this category:
- 26.67% were demo-only
- 26.67% offered a permanent free plan
- 33.33% provided a free trial only
- 13.33% were paid-only
This variety reflects how different the products are within advertising and creative workflows. The category includes self-service design tools as well as more advanced campaign and advertising platforms that rely on demonstrations or sales conversations.
AI Customer Engagement and CRO leaned more heavily toward permanent free access. I found that 53.33% offered a free plan, 33.33% were available through a free trial only, and 13.33% required a demo.
What this showed me is that the buying experience changes depending on the type of marketing software someone is evaluating. A user comparing video or social media platforms can usually begin testing immediately. Someone evaluating content, advertising, or more advanced optimization software is more likely to encounter a paid plan, a restricted trial, or a required product demonstration.
How Much Do AI Marketing Tools Cost?
Pricing was one of the most difficult parts of this analysis because AI marketing companies do not present their plans consistently.
Some tools publish a clear monthly subscription. Others calculate prices according to users, contacts, credits, advertising spend, generated content, or usage volume. Several enterprise platforms do not display a numerical price at all and require potential customers to contact their sales teams.
I did not treat all of these pricing structures as directly comparable.
For the numerical analysis, I used 72 tools with a public starting price that I could normalize in US dollars. Some usage-based products were included when they published a clear minimum price. Tools without a fixed entry point were excluded from averages and medians.
Only 60% of AI Marketing Tools Publish Straightforward Numerical Pricing
Before comparing prices, I checked how transparently each company presented its pricing.
I classified every tool into one of five groups:
- Public numerical pricing
- Dynamic or usage-based pricing
- Sales-led or custom pricing
- Public local-currency pricing
- One-time purchase
Only 60% of the tools published straightforward numerical pricing that a buyer could view without contacting the company or estimating usage.
Another 24% used dynamic or usage-based pricing. These products are commonly charged according to credits, contacts, traffic, users, generated assets, or campaign volume.
This does not always mean the price was completely hidden. Some usage-based tools published a clear minimum plan, while others required users to calculate the expected cost based on their activity. I included a tool in the numerical analysis only when I could identify a comparable public starting point.
I found that 13% of the tools followed a sales-led or custom-pricing model. Instead of showing a fixed price, these companies asked users to book a demo, contact sales, or request a quote.
This approach appeared more often among platforms serving enterprises, larger marketing teams, advertising departments, or businesses with complex implementation requirements.
The remaining tools included:
- 2% with public pricing displayed in another currency
- 1% using a one-time purchase model
I kept local-currency pricing separate rather than converting it using a temporary exchange rate. Currency conversion would have introduced another variable and made the price comparison less stable over time.
What stood out to me is that price transparency remains limited even in a highly competitive software market. A company can compare product features quickly, but understanding the actual cost may still require a sales call or a detailed usage estimate.
For buyers, this means the advertised starting price should not be the only number they check. It is also important to review usage limits, billing frequency, included users, credit allowances, contact limits, and the conditions that cause the monthly cost to increase.
AI SEO Tools Have the Highest Comparable Starting Prices
After separating comparable public prices from custom and dynamic pricing, I compared the average and median starting price across all seven categories.
The results showed a large difference between categories.
AI SEO was the most expensive category in my dataset. The 10 SEO tools with comparable pricing had:
- An average starting price of $96.59 per month
- A median starting price of $82 per month
That was significantly higher than every other category I analyzed.
The next most expensive category was AI Customer Engagement and CRO. Its nine comparably priced tools had an average starting price of $66.89 and a median of $59.
The full category comparison was:
| Category | Average starting price | Median starting price | Priced tools |
|---|---|---|---|
| AI SEO | $96.59 | $82.00 | 10 |
| AI Customer Engagement and CRO | $66.89 | $59.00 | 9 |
| AI Advertising and Creative | $49.20 | $29.00 | 10 |
| AI Content Creation | $41.41 | $37.50 | 12 |
| AI Social Media | $35.73 | $29.00 | 11 |
| AI Email and CRM | $27.20 | $22.50 | 10 |
| AI Video Marketing | $24.50 | $27.00 | 10 |
I included both the average and median because the average alone can be misleading.
For example, AI Advertising and Creative had an average starting price of $49.20, but its median was only $29. A few expensive advertising platforms pushed the average upward, while a typical tool in the category was priced much lower.
AI SEO showed a similar pattern. Its average of $96.59 was higher than its $82 median, partly because the category included products with starting prices above $100 and one tool priced at $299 per month.
AI Video Marketing showed the opposite pattern. Its average was $24.50, slightly below its $27 median. This suggests that several lower-cost products pulled the average down rather than a few expensive tools pushing it up.
For someone comparing tools, the median is often the more useful starting point. It shows the middle price in each category and is less affected by unusually expensive or inexpensive products.
The category itself also matters more than the overall market average. A buyer searching for an AI video or email tool will generally encounter much lower entry prices than someone comparing SEO or advanced customer-optimization platforms.
The Price Gap Between AI Marketing Categories Exceeds $70
The category table showed the exact averages and medians, but the visual comparison made the pricing gap much easier to see.
AI SEO had the highest average comparable starting price at $96.59 per month. AI Video Marketing had the lowest at $24.50.
That created a difference of $72.09 per month between the most expensive and least expensive categories in my dataset.
The chart also showed that most categories stayed below the $50 mark:
- AI Email and CRM: $27.20
- AI Video Marketing: $24.50
- AI Social Media: $35.73
- AI Content Creation: $41.41
- AI Advertising and Creative: $49.20
Only AI Customer Engagement and CRO, at $66.89, and AI SEO, at $96.59, moved clearly above that range.
This difference is important because one overall market average can hide how much the expected price changes by use case. The average comparable starting price across all priced tools was approximately $48, but that number is not equally useful for every buyer.
Someone looking for an AI video or email platform is likely to find several tools below the market-wide average. Someone comparing SEO software should expect a much higher starting point.
I also noticed that the more expensive categories often included products designed for technical teams, agencies, or businesses managing larger and more complex workflows. SEO tools may combine keyword research, content optimization, competitor analysis, rank tracking, site audits, and reporting. Customer engagement platforms may include automation, segmentation, personalization, lead management, and conversion analysis.
That does not mean every higher-priced tool provides better value. It means the category often includes a broader or more operationally complex set of features.
For buyers, I would compare a tool’s price with other products in the same category first. Comparing a $25 video tool with a $100 SEO platform is usually less useful because the products solve different problems and use different pricing structures.
Flat Subscriptions Are the Most Common Pricing Model
After comparing starting prices, I looked at how companies actually charge customers.
The pricing model matters because two tools with the same advertised starting price can become very different in cost once usage increases. One may charge a fixed monthly fee, while another may increase the price based on contacts, users, credits, traffic, or advertising spend.
| Pricing Model | Tool Count | Share of Tools |
|---|---|---|
| Flat subscription | 52 | 52% |
| Contact or subscriber based | 11 | 11% |
| Credit based | 9 | 9% |
| Per user or seat | 8 | 8% |
| Usage based | 5 | 5% |
| Ad or media spend based | 4 | 4% |
| Annual subscription | 2 | 2% |
| Conversation based | 2 | 2% |
| Per channel or workspace | 2 | 2% |
| Traffic or visitor based | 2 | 2% |
The table displays the 10 most common pricing models. Three tools in smaller pricing-model categories are not shown separately.
Flat subscriptions were the most common model in the dataset. I found that 52% of the tools charged a fixed subscription price for access to a defined plan.
This is the pricing structure most buyers are familiar with. A company selects a plan, pays a recurring monthly or annual fee, and receives a specific set of features and usage limits.
The next most common models were:
- Contact or subscriber-based: 11%
- Credit-based: 9%
- Per user or seat: 8%
- Usage-based: 5%
- Ad or media spend-based: 4%
Contact-based pricing appeared mainly in email, CRM, and customer engagement tools. The monthly price usually increased as the number of stored contacts, subscribers, or active profiles grew.
Credit-based pricing was more common among generative tools. Users received a fixed number of credits for tasks such as creating images, generating videos, producing content, or processing data.
Per-user pricing appeared more often in products designed for teams. This model may look affordable for an individual user, but the total cost can increase quickly when several team members need access.
I also found smaller pricing models based on:
- Annual subscriptions
- Conversations
- Channels or workspaces
- Traffic or visitors
- Advertising spend
The table displays the 10 most common pricing models. Three tools in less common pricing groups are not shown separately.
What stood out to me is that the starting price alone does not show the full cost of a tool. A flat subscription is usually easier to predict, while contact, credit, seat, and usage-based pricing can change significantly as a business grows.
For someone choosing between platforms, I would check the billing unit before comparing plan prices. A lower starting price may not remain cheaper if the tool charges for every user, contact, generated asset, or campaign.
All-in-One Tools Dominate Most Lower and Mid-Range Price Buckets
I then compared pricing position with tool type to see whether specialized products were more common at higher price points.
Instead of comparing raw tool counts, I measured the percentage of all-in-one and specialized tools inside each price bucket.
All-in-one platforms made up the majority of tools in every comparable price range below $250:
- 68% of tools priced under $20 were all-in-one
- 66% of tools between $20 and $49.99 were all-in-one
- 77% of tools between $50 and $99.99 were all-in-one
- 75% of tools between $100 and $249.99 were all-in-one
The strongest all-in-one concentration appeared in the $50 to $99.99 range. Ten of the 13 tools in that bucket were all-in-one platforms, while the remaining three were specialized products.
This challenges the idea that broader platforms are always more expensive. Many all-in-one tools in my dataset competed in lower and mid-range price brackets, giving users access to several marketing functions under one subscription.
The same pattern appeared among tools with custom pricing. Around 85% of the 13 custom-priced products were all-in-one platforms, while 15% were specialized.
That result makes sense when I look at the types of products using custom quotes. Many were larger platforms that combined automation, analytics, customer data, campaign management, or multiple communication channels. Their pricing often depended on company size, contacts, users, or implementation requirements.
Dynamic pricing was more balanced:
- 58% all-in-one
- 42% specialized
The $250+ and local-currency groups were both 100% specialized, but those percentages need context.
Only one tool appeared in the $250+ bucket, and only two tools were placed in the local-currency group. A 100% result based on one or two products is not strong enough to establish a broader market pattern.
The sample sizes shown beside each price bucket are therefore just as important as the percentages.
What I found most useful here is that tool type alone does not predict price. Buyers can find all-in-one and specialized products at several price levels. The more important comparison is whether they need broad workflow coverage or deeper functionality for one specific marketing task.
The Most Affordable AI Marketing Tools Start at $5 per Month
After comparing category averages, I wanted to identify the individual tools with the lowest comparable starting prices.
I sorted the 72 tools with public USD pricing from lowest to highest. I also kept their access type, free-plan availability, pricing model, and feature count beside the price because the cheapest subscription is not always the best-value option.
[Insert screenshot: Most Affordable AI Marketing Tools table]
Publer had the lowest starting price in the dataset at $5 per month, followed by Buffer at $6 per month. Both were AI social media tools, offered permanent free plans, and included seven of the features I tracked.
Several tools started below $10:
| Tool | Category | Starting price |
|---|---|---|
| Publer | AI Social Media | $5 |
| Buffer | AI Social Media | $6 |
| Brevo | AI Email and CRM | $9 |
| Koala AI | AI Content Creation | $9 |
| Rytr | AI Content Creation | $9 |
| Adobe Express | AI Advertising and Creative | $9.99 |
| Captions | AI Video Marketing | $9.99 |
The low-cost group covered several different use cases. I found affordable options for social media scheduling, email marketing, AI writing, creative design, and video production rather than one category dominating the entire list.
However, the access models were not identical.
Publer, Buffer, Brevo, Rytr, Adobe Express, and Captions offered permanent free plans. Koala AI started at $9 but was classified as paid-only, meaning users had to subscribe to continue using it.
This is why I would not compare these products using the advertised price alone. A $9 tool with no free access may require a faster commitment than a $15 tool that allows ongoing use through a permanent free plan.
The pricing mechanics also differed:
- Publer and Brevo used usage-based pricing
- Buffer charged by channel or workspace
- Koala AI, Rytr, Adobe Express, and Captions used flat subscriptions
- Flair.ai used a credit-based model
- Canva charged per user or seat
These differences can change the total cost as usage grows. A flat subscription may be easier to predict, while channel, user, contact, or credit-based plans can become more expensive when a team expands.
I also found that several tools starting between $10 and $16 offered seven or eight tracked features. Flair.ai started at $10 with seven features, Photoroom started at $12.99 with seven, and Canva started at $15 with eight.
That suggests buyers do not necessarily need to choose an expensive platform to access a broad feature set. But feature count only shows whether a capability exists. It does not measure its output quality, limits, depth, or reliability.
For someone working with a limited budget, I would first shortlist tools that offer both a low entry price and a permanent free plan. I would then compare the usage limits, required features, and the billing unit before upgrading.
The Highest Public Starting Prices Are Concentrated in SEO and Advertising
After reviewing the lowest-cost tools, I looked at the other end of the market.
I sorted the same 72 comparably priced tools from highest to lowest to see which products required the largest upfront monthly commitment. I kept custom-priced enterprise platforms out of this ranking because they did not publish a numerical starting price I could compare fairly.
Alli AI had the highest public starting price in my dataset at $299 per month. Optmyzr followed at $249 per month.
The next highest-priced tools were:
| Tool | Category | Starting price |
|---|---|---|
| Alli AI | AI SEO | $299 |
| Optmyzr | AI Advertising and Creative | $249 |
| Semrush | AI SEO | $139.95 |
| Clearscope | AI SEO | $129 |
| Writesonic | AI Content Creation | $99 |
| Surfer | AI SEO | $99 |
| Search Atlas | AI SEO | $99 |
| Sprout Social | AI Social Media | $99 |
| Unbounce | AI Customer Engagement and CRO | $99 |
| Vista Social | AI Social Media | $79 |
| Jasper | AI Content Creation | $69 |
| lemlist | AI Customer Engagement and CRO | $69 |
| Semrush Content Toolkit | AI Content Creation | $60 |
| Apollo.io | AI Customer Engagement and CRO | $59 |
| Keyword Insights | AI SEO | $58 |
AI SEO appeared more often than any other category in the highest-price list. Six of the 15 tools were primarily SEO platforms.
That supports the category-level pricing analysis I showed earlier. SEO tools often combine several data-heavy capabilities, such as keyword research, competitor analysis, rank tracking, technical audits, content optimization, and reporting. Buyers are often paying for access to datasets and workflows, not just one AI feature.
Advertising and creative software also appeared near the top. Optmyzr had the second-highest public starting price in the entire dataset, although most tools in that category started much lower.
Another pattern stood out around the $99 price point. Writesonic, Surfer, Search Atlas, Sprout Social, and Unbounce all started at $99, despite serving different marketing functions.
This shows why price alone is not enough to compare value. Two tools can charge the same monthly amount while targeting completely different teams, workflows, and outcomes.
I also treated these as starting prices rather than total ownership costs. Some platforms charge more for additional users, contacts, projects, workspaces, credits, or higher usage limits. A plan listed at $99 can therefore become significantly more expensive as a business grows.
Custom-priced enterprise platforms are also missing from this ranking. Their actual costs may be higher than the tools shown here, but I did not estimate or invent prices when the company required a sales conversation.
For buyers, the most useful comparison is not simply the cheapest tool against the most expensive one. I would first compare tools within the same category, then check which features, limits, integrations, and pricing units are included in the starting plan.
Higher Prices Do Not Consistently Provide More Features
I wanted to see whether a higher starting price usually meant that a tool included more marketing capabilities.
To test this, I compared the starting price of the 72 tools with comparable public USD pricing against the number of features I tracked for each product.
The chart did not show a clear pattern where feature count increased consistently with price.
Many tools included between six and eight tracked features, but their starting prices ranged from below $20 to nearly $300 per month. I also found lower-priced tools with feature counts similar to products costing several times more.
For example, several products below $50 included seven or eight tracked features. At the same time, some tools priced above $100 appeared in the same feature-count range.
This suggests that buyers are not always paying for a larger number of visible features.
They may instead be paying for:
- More advanced functionality
- Higher usage limits
- Better data quality
- Larger databases
- Team collaboration and permissions
- More integrations
- Enterprise support
- Workflow automation
- Brand recognition
- Specialized capabilities
This distinction is important because my feature count measures whether a capability was available, not how well it performed.
A basic analytics dashboard and an advanced reporting system may both count as “analytics and reporting.” Similarly, two tools may both provide AI text generation, while offering very different levels of control, output quality, languages, templates, and usage limits.
I also did not use the chart to claim a precise statistical relationship. Visually, the points do not form a strong upward pattern, but a formal correlation analysis would be needed to measure the relationship accurately.
What the chart does show clearly is that price and feature quantity are not the same thing.
A more expensive tool may offer deeper functionality for a specific workflow, while an affordable all-in-one platform may include a wider collection of basic capabilities.
For buyers, I would not use feature count as the main measure of value. I would first identify the few capabilities that matter most, then compare their quality, limits, integrations, and pricing across the shortlisted tools.
Which Features Are Most Common Across AI Marketing Tools?
After comparing pricing, I looked at the capabilities that appeared most often across the 100 tools.
I wanted to understand which features had become standard across the market and which were still limited to smaller groups of products.
Analytics and Reporting Is the Most Common AI Marketing Capability
I counted each standardized feature once per tool, even when a company described the same capability using several different terms.
Analytics and reporting appeared in 75 of the 100 tools, making it the most common feature in the dataset.
This was not surprising. Whether a platform focuses on content, SEO, advertising, email, social media, or customer engagement, users still need a way to measure performance.
API access was the second most common capability, appearing in 58 tools. Team collaboration followed closely at 55 tools.
The most frequently identified features were:
| Feature | Number of tools |
|---|---|
| Analytics and reporting | 75 |
| API access | 58 |
| Team collaboration | 55 |
| AI text generation | 38 |
| Personalization | 30 |
| Email automation | 17 |
| Lead generation | 17 |
| Marketing automation | 17 |
| Social media scheduling | 17 |
Several other features appeared in approximately 16 tools, but they were usually connected to more specific marketing workflows.
What stood out to me was that the most common capabilities were not all generative AI features.
Analytics, APIs, and collaboration appeared more often than AI text generation. This suggests that many AI marketing products are positioning AI as one part of a wider workflow rather than as the entire product.
For example, a content platform may generate text, but users also need to review performance, share projects with a team, connect the tool to another platform, and move the output into an existing workflow.
The same applies to personalization. It appeared in 30 tools, making it common but not universal. Personalized recommendations, messages, campaigns, or customer experiences are important in several categories, but they are not equally relevant to every marketing product.
The lower counts for email automation, lead generation, marketing automation, and social scheduling do not mean those features are unimportant. They are more closely tied to specific categories, so they naturally appear in fewer tools across the complete dataset.
I would also avoid choosing a platform simply because it contains many common features. Analytics and API access may appear on a product page, but the quality, limits, integrations, and depth can vary significantly.
For buyers, the useful question is not only whether a feature exists. It is whether that feature supports the exact workflow, volume, and level of control they need.
The Most Feature-Rich Tools Reached Eight Tracked Capabilities
I ranked the tools by feature count to see which products covered the widest range of capabilities in my standardized dataset.
The maximum was eight tracked features per tool. Several platforms reached that number, so the table shows 15 of the highest-ranking products rather than one clear winner.
| Tool Name | Category | Feature Count | Key Features | Website |
|---|---|---|---|---|
| AdCreative.ai | AI Advertising & Creative | 8 | Ad creative generation, campaign optimization, analytics and reporting, team collaboration, AI image generation, AI text generation, ad platform integrations, API access | adcreative.ai |
| Adobe Express | AI Advertising & Creative | 8 | Ad creative generation, campaign optimization, analytics and reporting, team collaboration, AI image generation, video editing, brand kit, API access | adobe.com/express |
| Ahrefs | AI SEO | 8 | Keyword research, content optimization, competitor analysis, analytics and reporting, backlink analysis, rank tracking, site audit, API access | ahrefs.com |
| Apollo.io | AI Customer Engagement & CRO | 8 | Lead generation, personalization, analytics and reporting, marketing automation, lead database, sales engagement, email automation, API access | apollo.io |
| Brandwatch | AI Social Media | 8 | Social scheduling, AI text generation, analytics and reporting, team collaboration, social listening, consumer intelligence, influencer marketing, API access | brandwatch.com |
| Brevo | AI Email & CRM | 8 | Email automation, audience segmentation, personalization, analytics and reporting, SMS marketing, CRM, transactional email, API access | brevo.com |
| Canva | AI Advertising & Creative | 8 | Ad creative generation, campaign optimization, analytics and reporting, team collaboration, AI image generation, video editing, brand kit, API access | canva.com |
| Chatfuel | AI Customer Engagement & CRO | 8 | Lead generation, personalization, analytics and reporting, marketing automation, customer messaging, WhatsApp automation, AI agents, API access | chatfuel.com |
| Clay | AI Customer Engagement & CRO | 8 | Lead generation, personalization, analytics and reporting, marketing automation, data enrichment, outbound automation, AI research, API access | clay.com |
| Customers.ai | AI Customer Engagement & CRO | 8 | Lead generation, personalization, analytics and reporting, marketing automation, identity resolution, audience activation, email automation, API access | customers.ai |
| Hootsuite | AI Social Media | 8 | Social scheduling, AI text generation, analytics and reporting, team collaboration, social engagement inbox, social listening, campaign management, API access | hootsuite.com |
| Hotjar | AI Customer Engagement & CRO | 8 | Lead generation, personalization, analytics and reporting, marketing automation, behavior analytics, heatmaps, surveys, API access | hotjar.com |
| HubSpot Marketing Hub | AI Email & CRM | 8 | Email automation, audience segmentation, personalization, analytics and reporting, CRM, lead generation, landing pages and CRO, API access | hubspot.com/products/marketing |
| Instantly | AI Email & CRM | 8 | Email automation, audience segmentation, personalization, analytics and reporting, cold outreach, lead database, CRM, API access | instantly.ai |
| Intercom | AI Customer Engagement & CRO | 8 | Lead generation, personalization, analytics and reporting, marketing automation, customer messaging, AI agents, help desk, API access | intercom.com |
The list included:
- AdCreative.ai
- Adobe Express
- Ahrefs
- Apollo.io
- Brandwatch
- Brevo
- Canva
- Chatfuel
- Clay
- Customers.ai
- Hootsuite
- Hotjar
- HubSpot Marketing Hub
- Instantly
- Intercom
These tools came from five different categories. AI Customer Engagement and CRO had the strongest representation, accounting for six of the 15 tools. AI Advertising and Creative and AI Email and CRM each contributed three.
What stood out to me was not simply that these products had eight features. It was the type of capabilities that repeatedly appeared together.
Every tool in the top 15 included both analytics and reporting and API access. Most also combined a category-specific capability with collaboration, automation, personalization, or workflow features.
For example, AdCreative.ai combined ad creative generation and campaign optimization with AI image generation, AI text generation, reporting, team collaboration, advertising integrations, and API access.
Ahrefs reached the same feature count through a completely different combination: keyword research, content optimization, competitor analysis, backlink analysis, rank tracking, site auditing, reporting, and API access.
Apollo.io combined lead generation, personalization, a lead database, sales engagement, email automation, marketing automation, reporting, and API access.
This is another reason I would not treat feature count as a direct product-quality score. Two tools can both include eight tracked features while serving completely different audiences and workflows.
The count also reflects the feature categories I standardized for this study. It does not represent every button, integration, template, or minor function available inside each platform.
A tool with eight tracked capabilities may offer hundreds of smaller functions within them. Another product with six tracked capabilities may provide greater depth in one specialized area.
For buyers, I would use this table to identify broad platforms worth investigating, not to select a winner automatically. The better question is whether the tool covers the specific features required for the workflow, and whether those features are available within the plan being considered.
Who Are AI Marketing Tools Built For?
After analyzing pricing and features, I wanted to understand who these tools were actually designed to serve.
Most AI marketing platforms mention several potential customer groups on their websites. A product may promote itself to small businesses, agencies, freelancers, marketing teams, and enterprises at the same time. But listing every possible audience does not always reveal who the product is primarily built around.
To make this comparison clearer, I analyzed the customer data in two ways.
First, I assigned one primary target customer to each tool based on its main positioning, product messaging, features, and typical workflow. This helped me identify the audience each platform appeared to prioritize most strongly.
I then recorded every additional customer segment mentioned by the company. This broader view showed how widely each tool positioned itself across the market.
Separating these two measurements was important. A tool may primarily serve marketing teams while also being suitable for agencies, small businesses, and freelancers. Counting only the primary audience would miss that wider reach, while combining every audience without distinction would make the positioning difficult to interpret.
The results showed a clear difference between the people managing the tools and the businesses the companies hope to reach. Marketing teams were the most common primary users, while small businesses appeared most often in the broader product positioning.
Marketing Teams Are the Most Common Primary Audience
I assigned one primary target customer to each tool based on the audience emphasized most clearly across its homepage, product pages, use cases, and pricing structure.
Marketing teams were the most common primary audience by a wide margin.
[Insert screenshot: Primary Target Customer by Tool Count]
I classified 42 of the 100 tools as primarily built for marketing teams. These products usually combined several workflows, such as content production, campaign management, analytics, automation, collaboration, or customer engagement.
The complete breakdown was:
| Primary target customer | Tool count |
|---|---|
| Marketing teams | 42 |
| Enterprises | 13 |
| Content creators | 12 |
| Individual marketers | 10 |
| Agencies | 8 |
| Sales teams | 6 |
| Ecommerce businesses | 5 |
| Customer support teams | 2 |
| Growth teams | 2 |
Enterprises were the second most common primary audience, but they accounted for only 13 tools. These platforms were more likely to use custom pricing, sales-led onboarding, advanced permissions, and broader implementation support.
Content creators followed with 12 tools. This group appeared mainly across AI content creation, video marketing, and creative platforms.
Another 10 tools were primarily positioned toward individual marketers. These products generally emphasized simple setup, self-service access, and lower starting prices.
Only eight tools focused primarily on agencies, even though agencies appeared much more often in the broader customer positioning. This distinction matters. Many platforms support agency workflows without making agencies their main audience.
Sales teams, ecommerce businesses, customer support teams, and growth teams represented smaller primary groups. Their lower counts do not mean these audiences are ignored. In many cases, they appeared as secondary users of broader marketing or customer-engagement platforms.
What stood out to me is that AI marketing software is largely designed around team-based workflows. Even when a product is accessible to an individual user, its positioning often emphasizes collaboration, campaign management, reporting, shared assets, and integrations.
For a buyer, the primary audience is worth checking before comparing features. A platform built around enterprise marketing teams may include more controls and integrations, but it may also be more complex and expensive than a tool designed for an individual marketer or content creator.
Small Businesses Appear in the Positioning of 80 AI Marketing Tools
The primary-audience analysis showed who each tool appeared to prioritize. I then looked at every customer segment mentioned across the product positioning.
This produced a much broader picture of market reach.
[Insert screenshot: Target Customer Reach]
Small businesses appeared in the positioning of 80 tools, making them the most frequently mentioned customer segment in the dataset.
Marketing teams appeared in 70 tools, while agencies were mentioned by 61.
The complete customer-reach data included:
| Customer segment | Tools mentioning the segment |
|---|---|
| Small businesses | 80 |
| Marketing teams | 70 |
| Agencies | 61 |
| Freelancers | 22 |
| Enterprises | 17 |
| Content creators | 12 |
| Individual marketers | 10 |
| Sales teams | 6 |
| Ecommerce businesses | 5 |
| Customer support teams | 2 |
| Growth teams | 2 |
One tool could target several customer groups, so the combined counts exceed 100.
The difference between primary audience and broader reach was especially clear for small businesses. Small businesses appeared in the positioning of 80 tools, but they were not the most common primary audience. Most platforms still centered their main messaging around marketing teams.
This suggests that many companies treat small businesses as a broad commercial segment rather than a specific user role. A product may be designed for a marketing team, agency, or content creator while still promoting a plan as suitable for small businesses.
Agencies showed a similar pattern. Only eight tools were primarily built around agencies, but 61 mentioned agencies somewhere in their positioning.
This makes sense because agencies can use tools from almost every category. They may need content creation, SEO, advertising, social media management, email automation, reporting, or client collaboration.
Freelancers appeared in 22 tools, which was much lower than small businesses, marketing teams, or agencies. Enterprise positioning was also less widespread than I expected, appearing in 17 products.
What I found most interesting is how broad the product messaging has become. Many AI marketing platforms try to appeal to individual users, small companies, agencies, and larger teams at the same time.
That broad positioning can make the product appear more flexible, but it does not always mean every audience receives the same level of support. A small-business plan may have strict usage limits, while enterprise customers may receive additional security, onboarding, integrations, and account management.
For buyers, I would look beyond the audience labels on the homepage. The more useful questions are whether the pricing, workflow, feature depth, and usage limits match the way the team will actually use the product.
Key Findings From the 100 AI Marketing Tools I Analyzed
After reviewing the pricing, access models, features, categories, and target customers, several findings stood out.
1. All-in-one platforms dominate the dataset
I classified 68% of the tools as all-in-one platforms and 32% as specialized products.
This shows that many companies are packaging AI inside broader marketing workflows rather than selling one isolated capability.
2. Free trials are more common than permanent free plans
I found that:
- 43% offered a permanent free plan
- 54% offered a free trial
The difference varied significantly by category. AI Video Marketing relied heavily on free plans, while AI Social Media and AI SEO were more likely to offer trials.
3. API access is widely available
A total of 76% of the tools provided public, limited, or documented API access.
This suggests that integrations and automated workflows are becoming important parts of AI marketing products, even when the tool is designed for nontechnical users.
4. Clear pricing is still not universal
Only 60% of the tools published straightforward numerical pricing.
The rest used dynamic pricing, usage-based calculations, custom quotes, local-currency pricing, or one-time payments.
This made pricing one of the least standardized parts of the study.
5. The typical comparable starting price is closer to $29 than $48
Among the 72 tools with comparable public USD pricing:
- The average starting price was approximately $48
- The median starting price was $29
The difference shows how a small number of expensive tools raised the average.
6. AI SEO is the most expensive category
AI SEO had:
- An average comparable starting price of $96.59
- A median comparable starting price of $82
AI Video Marketing had the lowest average at $24.50, creating a category-level gap of more than $70.
7. Flat subscriptions are the dominant pricing model
Flat subscriptions accounted for 52% of the tools.
However, I also found pricing based on contacts, credits, users, usage, traffic, workspaces, and advertising spend.
This means the monthly starting price does not always reflect the long-term cost.
8. Analytics and reporting is the most common feature
Analytics and reporting appeared in 75 tools, ahead of API access at 58 and team collaboration at 55.
AI text generation appeared in 38 tools, showing that generative features were common but not as universal as broader workflow capabilities.
9. Higher prices do not consistently mean more features
The price-versus-feature chart did not show a clear upward pattern.
Many low-cost and high-cost tools included a similar number of tracked features. Buyers may be paying for depth, data quality, usage limits, support, or specialization rather than a larger feature list.
10. Marketing teams are the main users, but small businesses have the broadest reach
Marketing teams were the primary audience for 42 tools.
Small businesses appeared in the broader positioning of 80 tools, followed by marketing teams at 70 and agencies at 61.
This shows a difference between the user a product is designed around and the wider market the company wants to attract.
Limitations of This AI Marketing Tools Study
I designed this study to make the data as consistent and transparent as possible, but it still has several limitations.
The dataset is a selected sample
I analyzed 100 active AI marketing tools. This is not an exhaustive census of every platform available.
New products launch frequently, existing tools change direction, and some platforms could reasonably fit into more than one category.
The category sizes were structured
I selected 15 tools from six categories and 10 from AI Video Marketing.
This gave me enough products to compare categories consistently, but the category totals do not represent actual market size or market share.
Pricing can change quickly
The data was verified on August 5, 2026.
Companies may update their plans, prices, limits, billing structures, or free-access policies after that date.
Not every price was directly comparable
I used 72 tools in numerical pricing calculations.
I excluded custom quotes, prices without a fixed entry point, one-time payments, and unconverted local-currency prices from averages and medians.
The results therefore describe publicly comparable starting prices, not the full cost of every tool in the dataset.
Starting price does not equal total cost
A tool may charge more as the number of users, contacts, credits, projects, channels, or generated assets increases.
I compared the lowest qualifying public entry price, not the long-term cost for every possible business size.
Feature count measures availability, not quality
I counted whether a standardized feature appeared in a tool.
I did not score:
- Output quality
- Accuracy
- Reliability
- Ease of use
- Feature depth
- Usage limits
- Customer support
- Integration quality
Two tools may both include the same feature while delivering very different experiences.
Product categories can overlap
An AI content tool may also provide SEO optimization, image generation, social media publishing, or email features.
I assigned one primary category based on the product’s main positioning so each tool would appear only once in category-level comparisons.
Target customers were based on public messaging
I identified customer segments from official product positioning, use cases, plan descriptions, and feature pages.
A company’s stated audience may not perfectly reflect its actual customer base.
These limitations do not make the findings unusable. They define what the data can and cannot show, and they help prevent the numbers from being interpreted more broadly than the research supports.
What I Learned From Analyzing 100 AI Marketing Tools
The AI marketing software market is broader and less standardized than most tool lists make it appear.
Most products in my dataset were not built around one isolated AI function. They combined AI with analytics, automation, collaboration, integrations, and other parts of the marketing workflow.
All-in-one platforms represented 68% of the tools, but that does not mean specialized software is disappearing. Specialized products still play an important role when a team needs deeper functionality for SEO, advertising, video production, customer engagement, or another specific task.
Access was relatively common. More than half of the tools offered a free trial, and 43% provided a permanent free plan. However, the type of access depended heavily on the category.
Pricing was much harder to compare.
Only 60% of the tools published straightforward numerical pricing, and only 72 had public USD prices that I could use in a consistent numerical analysis.
Among those tools, the median starting price was $29, but category-level prices varied significantly. AI SEO was the most expensive category, while AI Video Marketing and AI Email and CRM had much lower average entry prices.
I also found that a higher price did not consistently provide more tracked features. Affordable platforms often included a feature count similar to products costing several times more.
That does not mean the cheaper tool is automatically better. More expensive platforms may provide stronger data, higher limits, better integrations, deeper functionality, or more advanced support.
The most useful lesson from this study is that buyers should not select a platform based on one number.
I would compare tools using four questions:
- Does the product support the exact workflow I need?
- How does the price increase as my usage or team grows?
- Are the important features included in the starting plan?
- Can I test the product properly before committing?
Feature count, starting price, and free access are useful filters. They are not substitutes for understanding how the tool will perform inside a real marketing workflow.
That is the difference between choosing a tool because it looks impressive and choosing one that actually fits the work.
Final Thoughts
After analyzing 100 AI marketing tools, I found that pricing, access, and features vary significantly by category.
All-in-one platforms dominate the dataset, free trials are more common than permanent free plans, and only 72 tools had comparable public USD pricing. I also found that higher prices do not consistently mean more features.
The best approach is to compare tools based on your required workflow, pricing structure, usage limits, and included features rather than choosing by price or feature count alone.
The data was verified on August 5, 2026. Always confirm the latest pricing and features on the official website.


 Hamidul Haque
 Aug 23, 2026